Loading course data…
Your Caddie Is Ready
The full 18-hole game plan for this course, which club off every tee, where to aim, what to avoid, and why. Personalized to your handicap and clubs.
Digital Yardage Books
Hole-by-hole diagrams with distances, green maps, and club recommendations. Download as PDF.
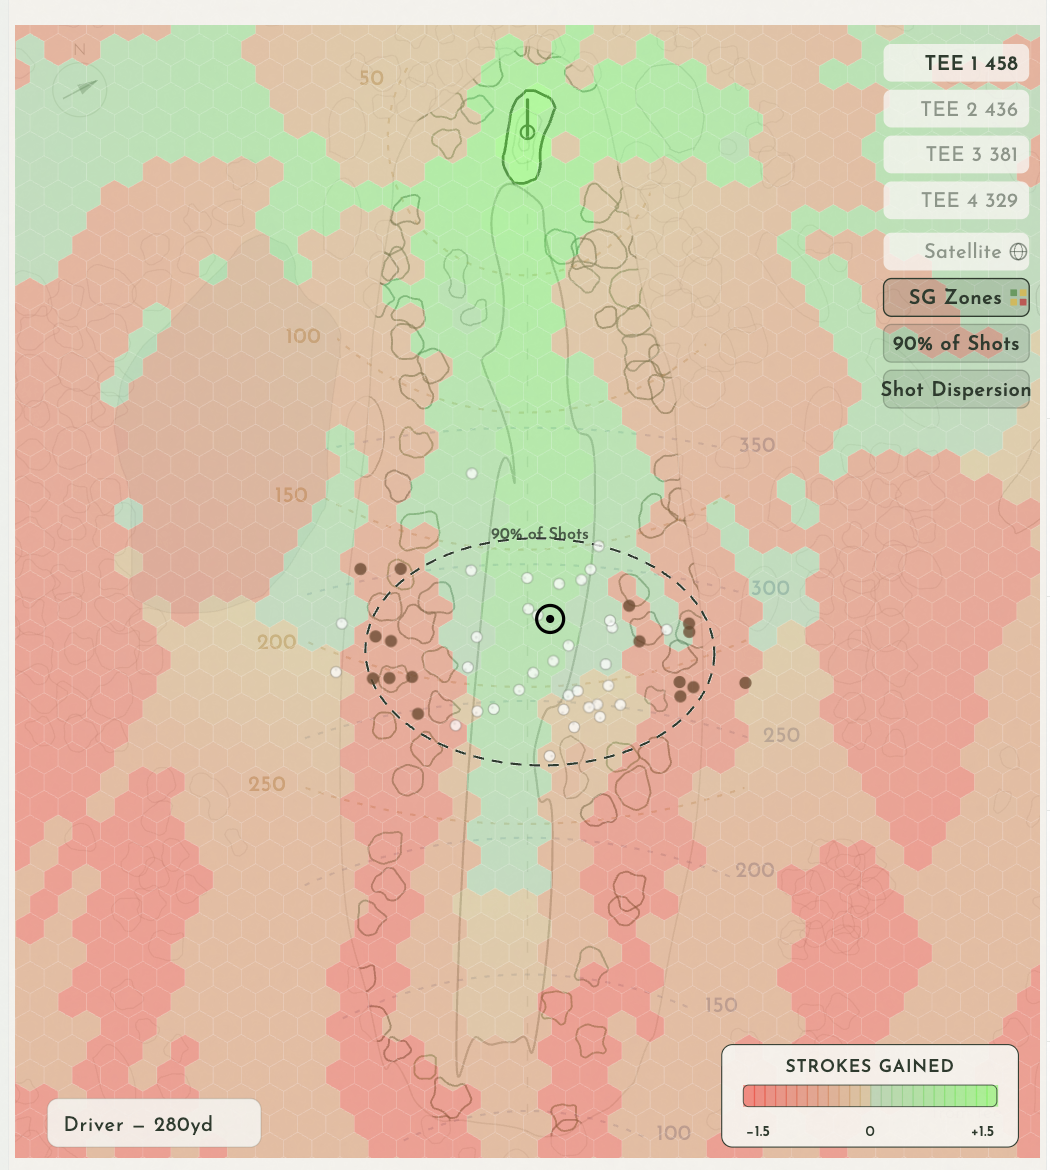
Strokes Gained Heat Maps
See strokes gained at every position on every hole. Find the best miss.
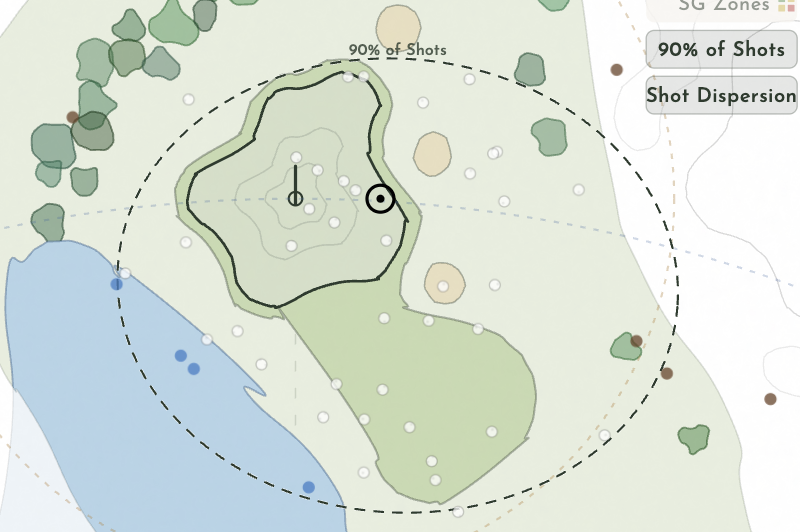
Shot Dispersion & Strategy
1,000-shot simulation for every club with personalized club and target recommendations.
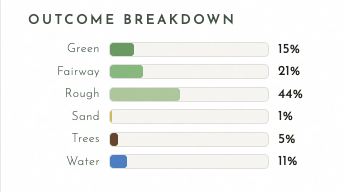
Outcome Breakdown
Fairway %, sand, water, trees, and expected strokes for every club choice.
Pick your tee above to see your distances
Each dot is a simulated shot from your dispersion pattern
Scroll down for club recommendation and strategy
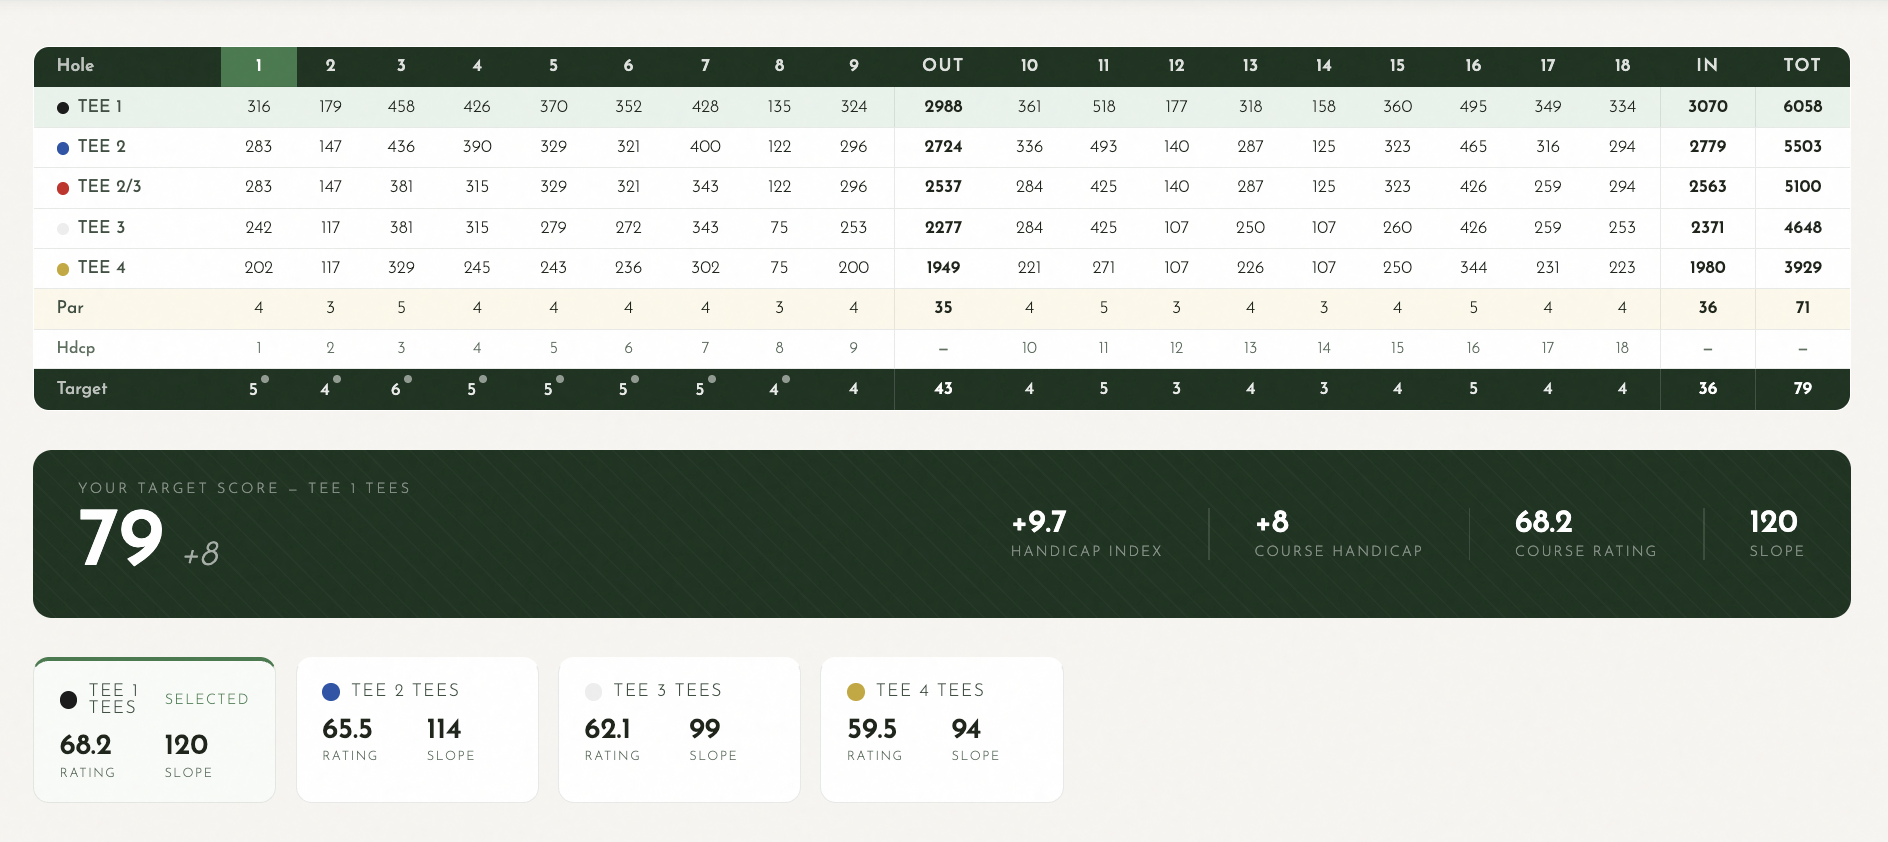
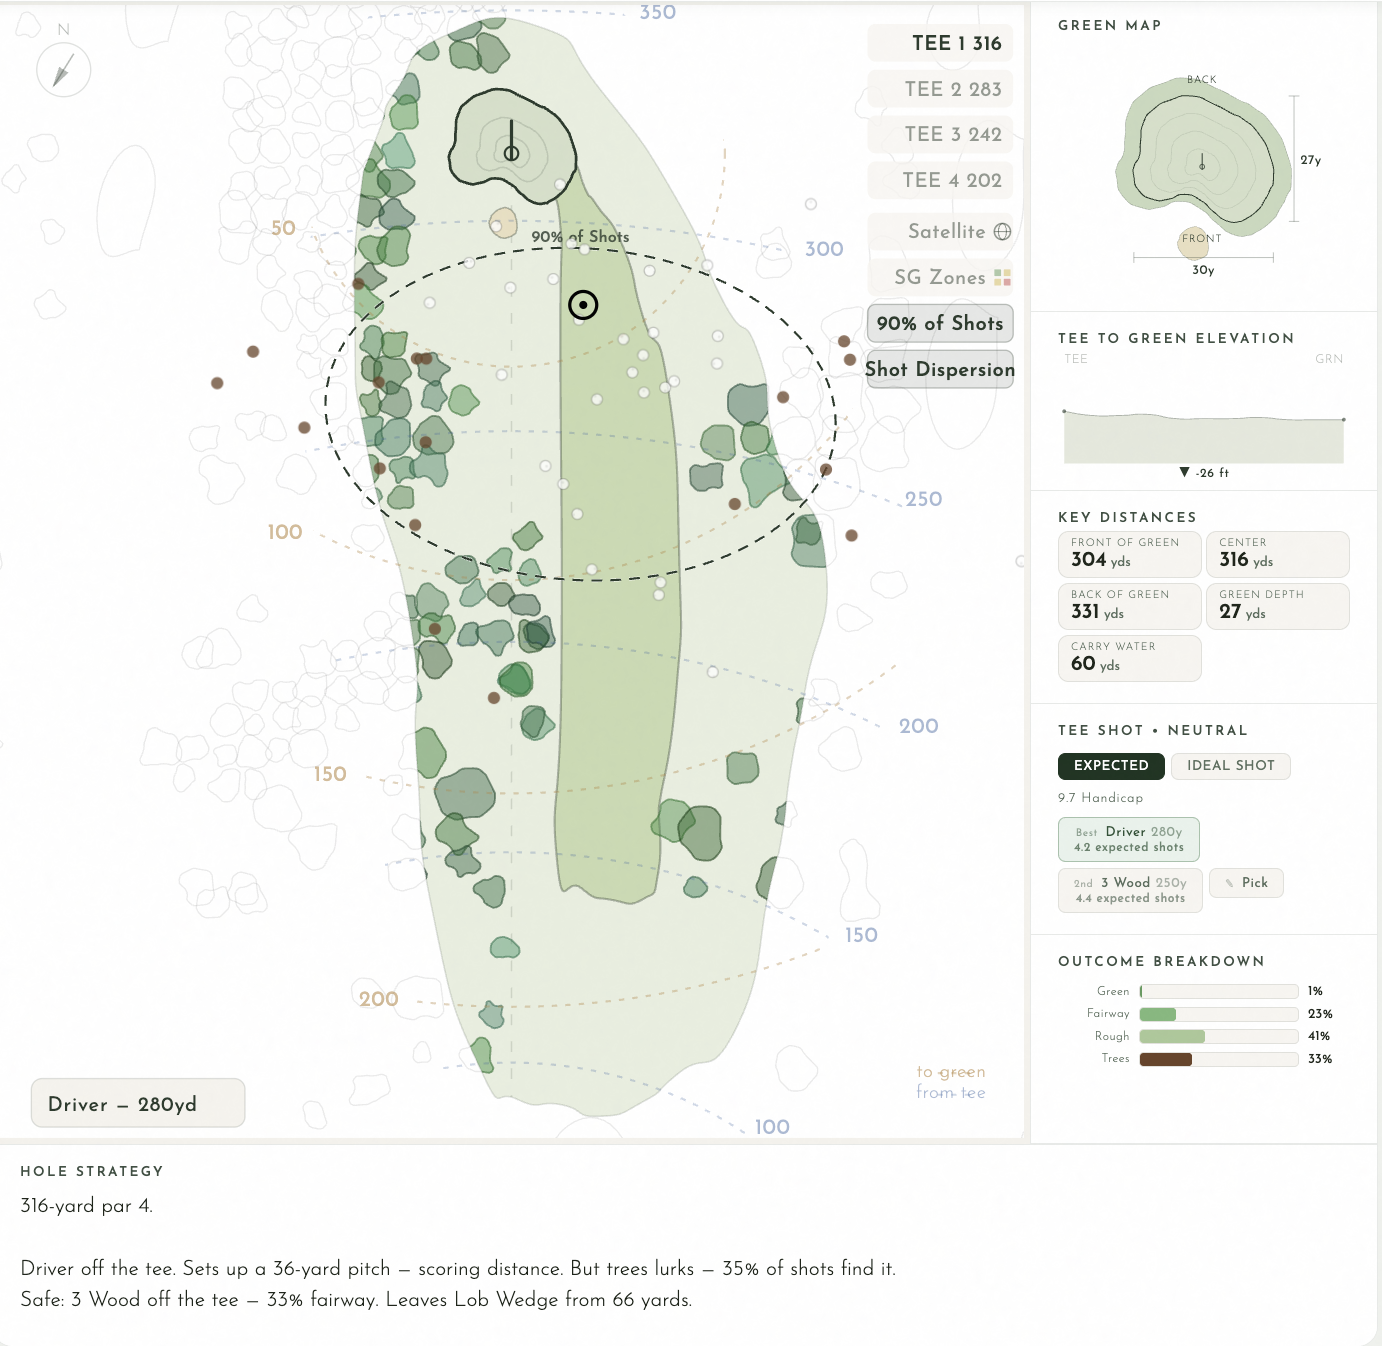
Hole 1
.
Par
.
Hdcp .
Your Par .
Computing strokes-gained recommendation…
Green Map
Tee to Green Elevation
Key Distances
Map Layers
Shot Display
Data Source
Tee Shot Model
Outcome Breakdown
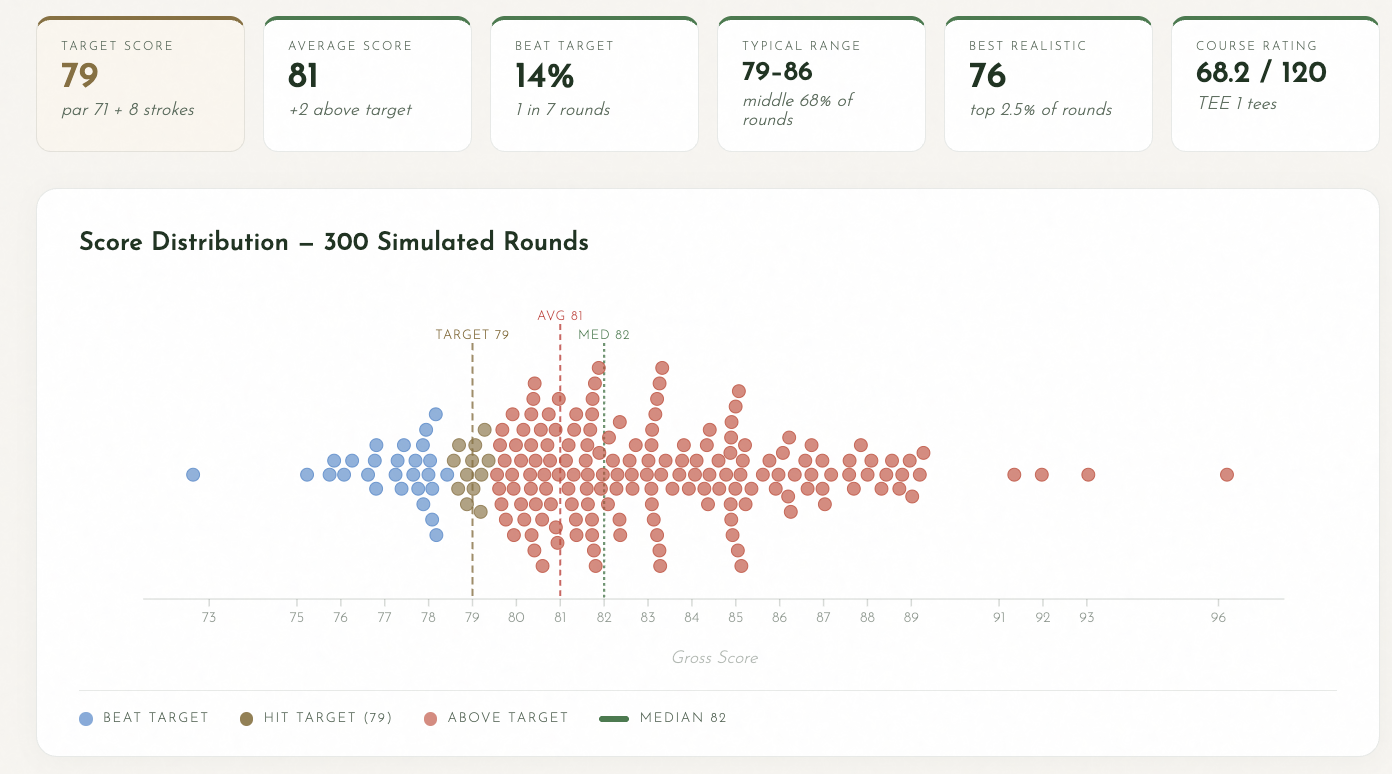
Scoring Probability
Hole Strategy
Hole Strategy
Wind Direction
My Bag
▶