/ Method
Three things make the plan.
Player
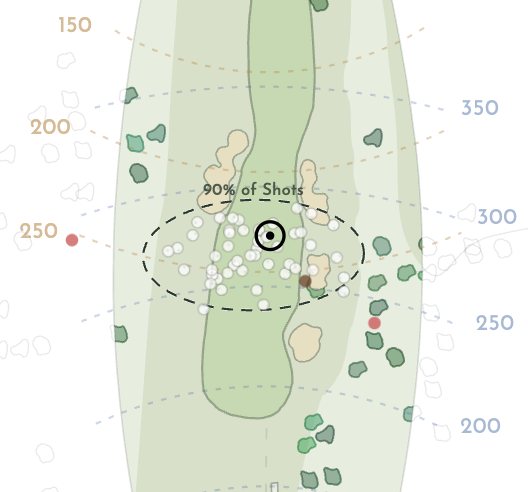
Tell your caddie your game.
Handicap index and how far you hit each club. That's all it needs. Your shot dispersion pattern is modeled from USGA handicap research data for your skill level.
Course
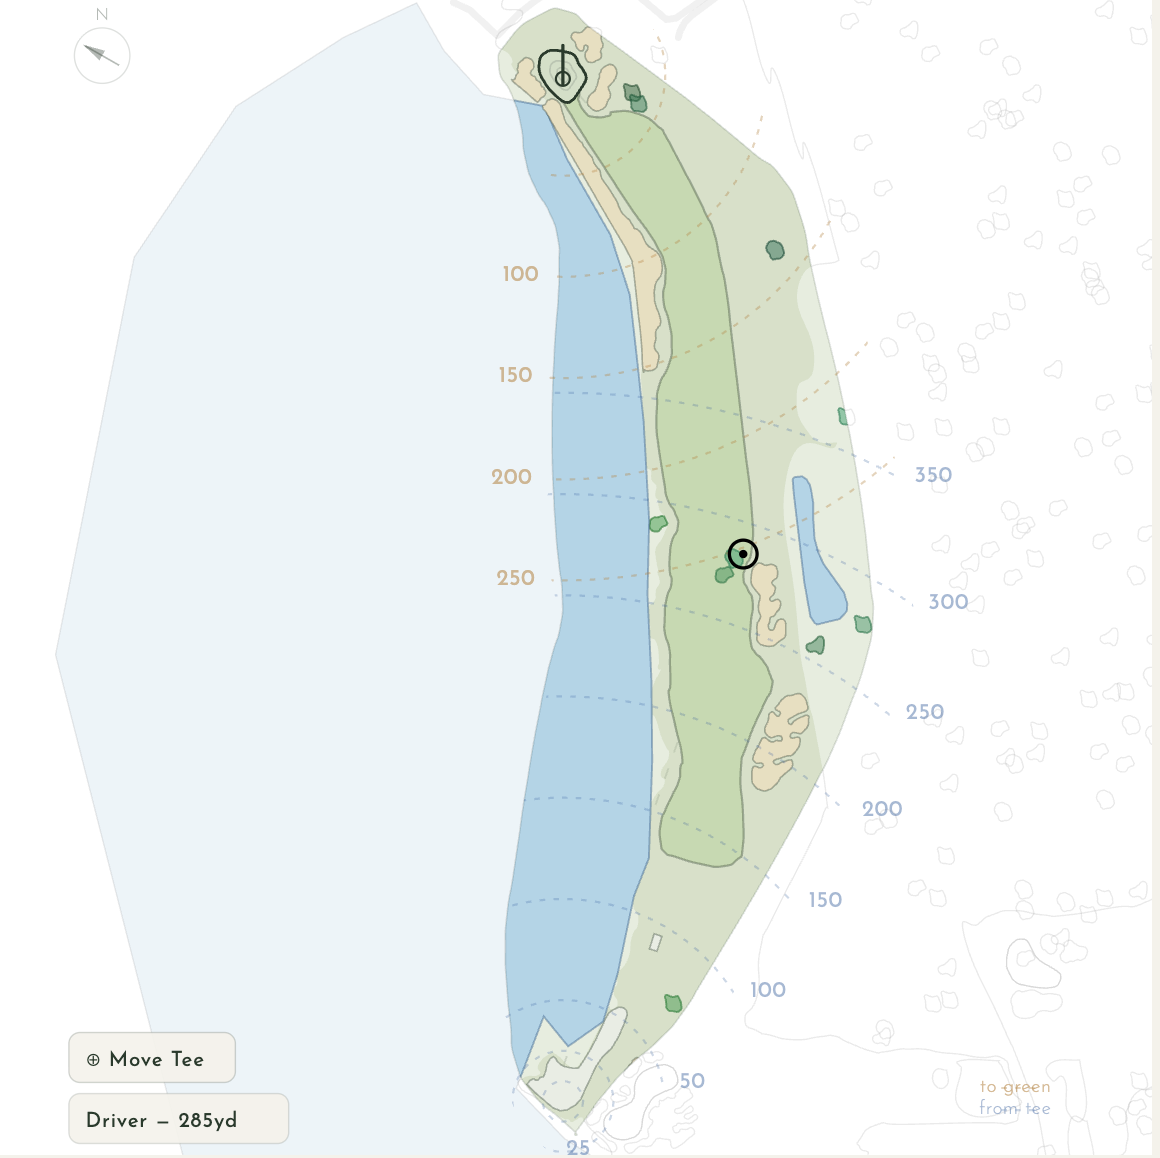
Pick the course.
199 courses fully mapped with hole-by-hole strategy. Every fairway, bunker, water hazard, tree, and green traced from satellite imagery and OpenStreetMap. New courses go live every week.
Plan
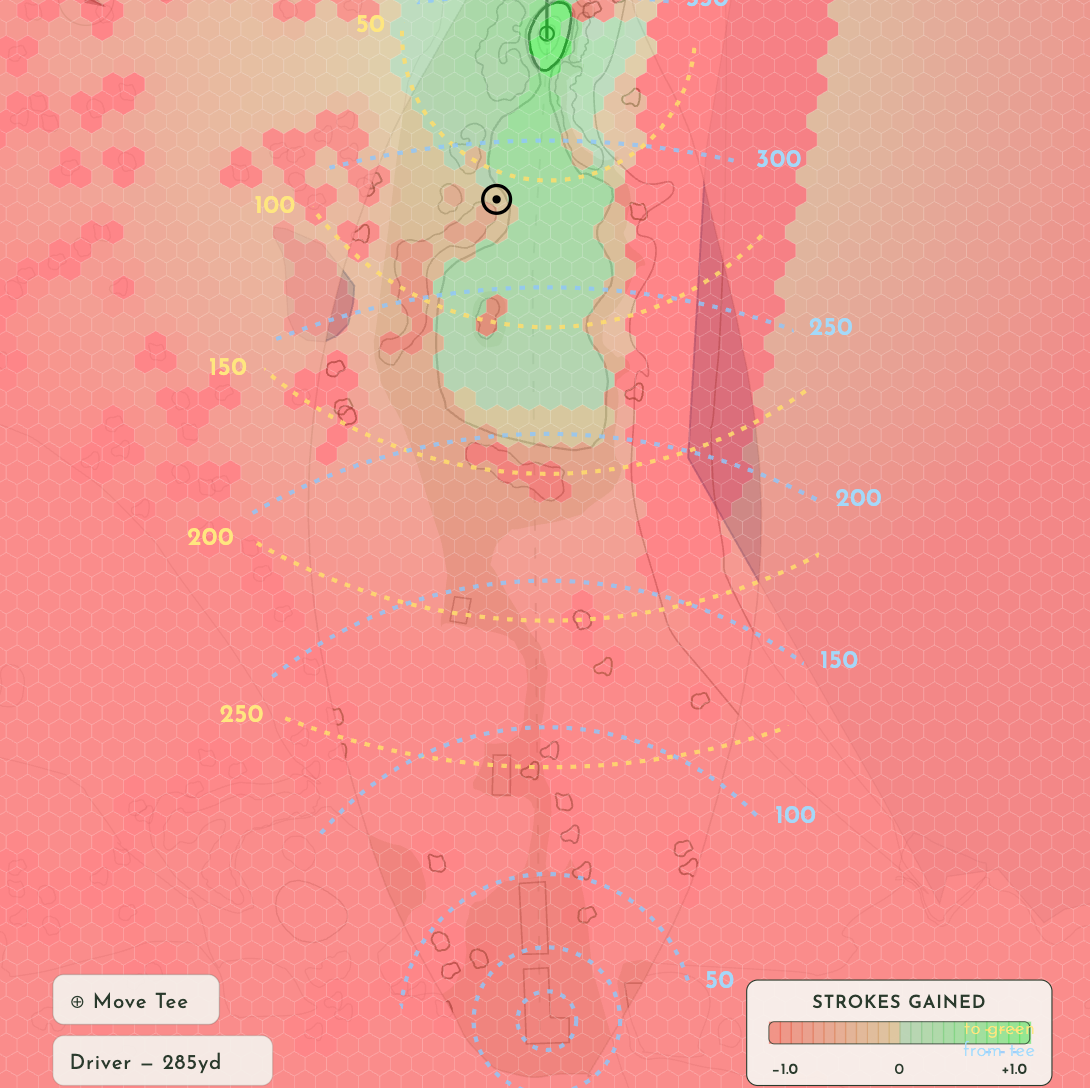
Study the game plan.
For every hole: which club scores best, where to aim, what the miss costs, and why. Use it on your phone, or print the PDF and walk to the first tee with a plan.