Golf Course

Hole 1
.
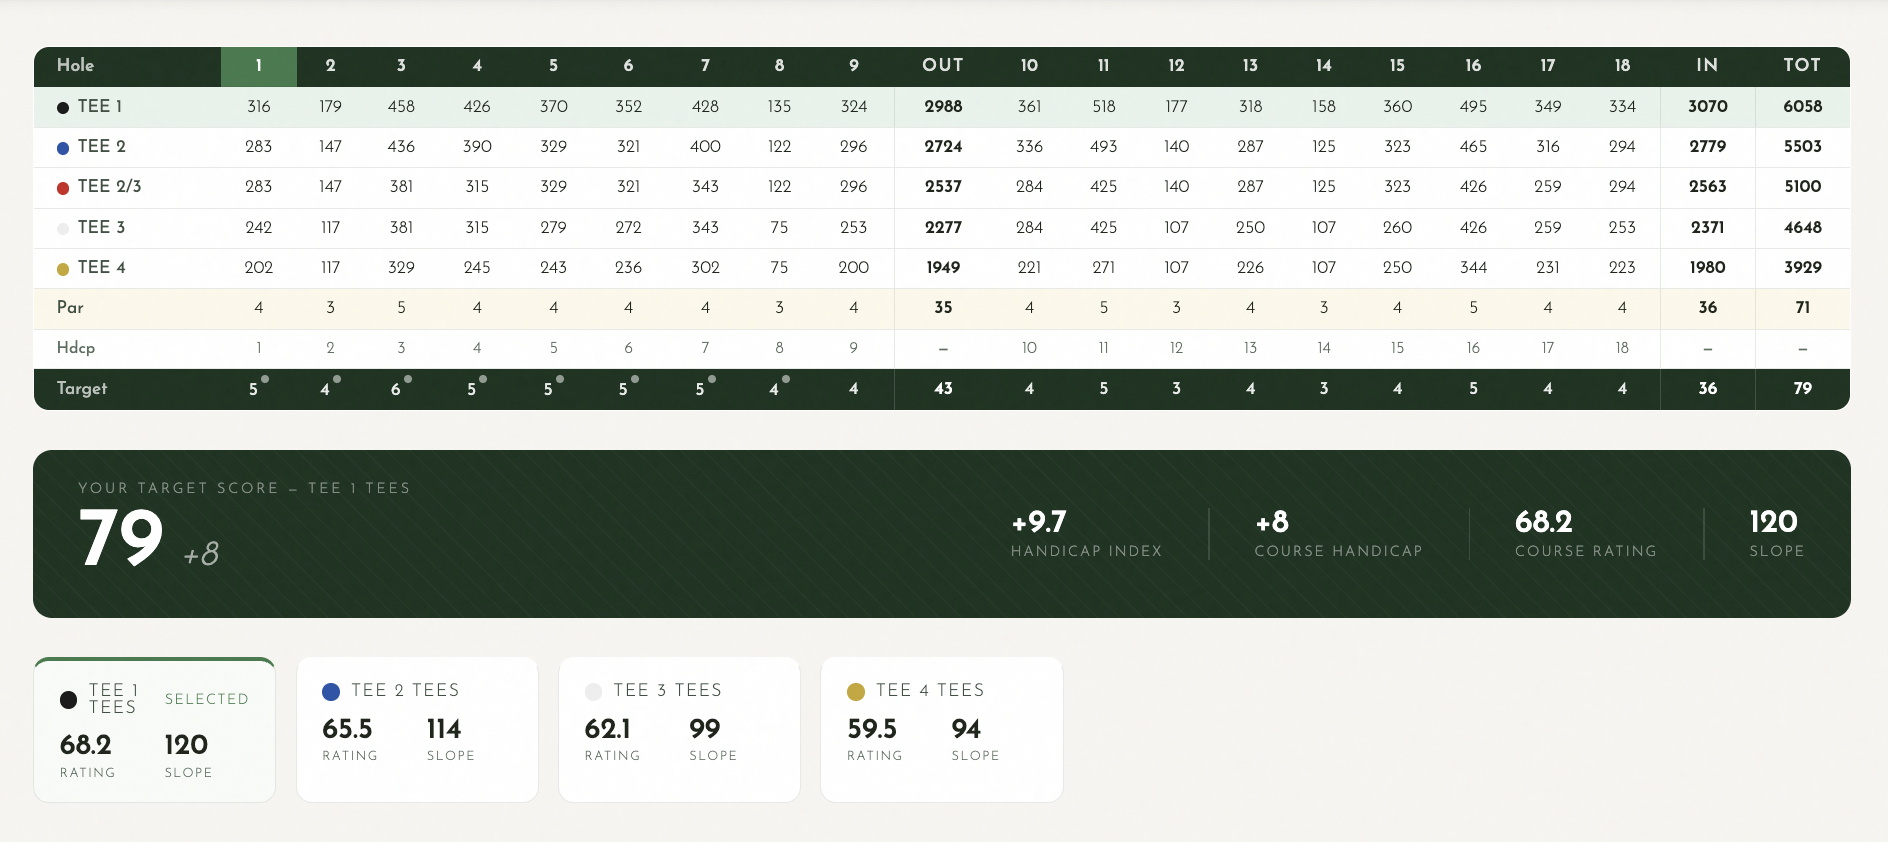
Par
.
Hdcp .
Your Par .
Computing strokes-gained recommendation…
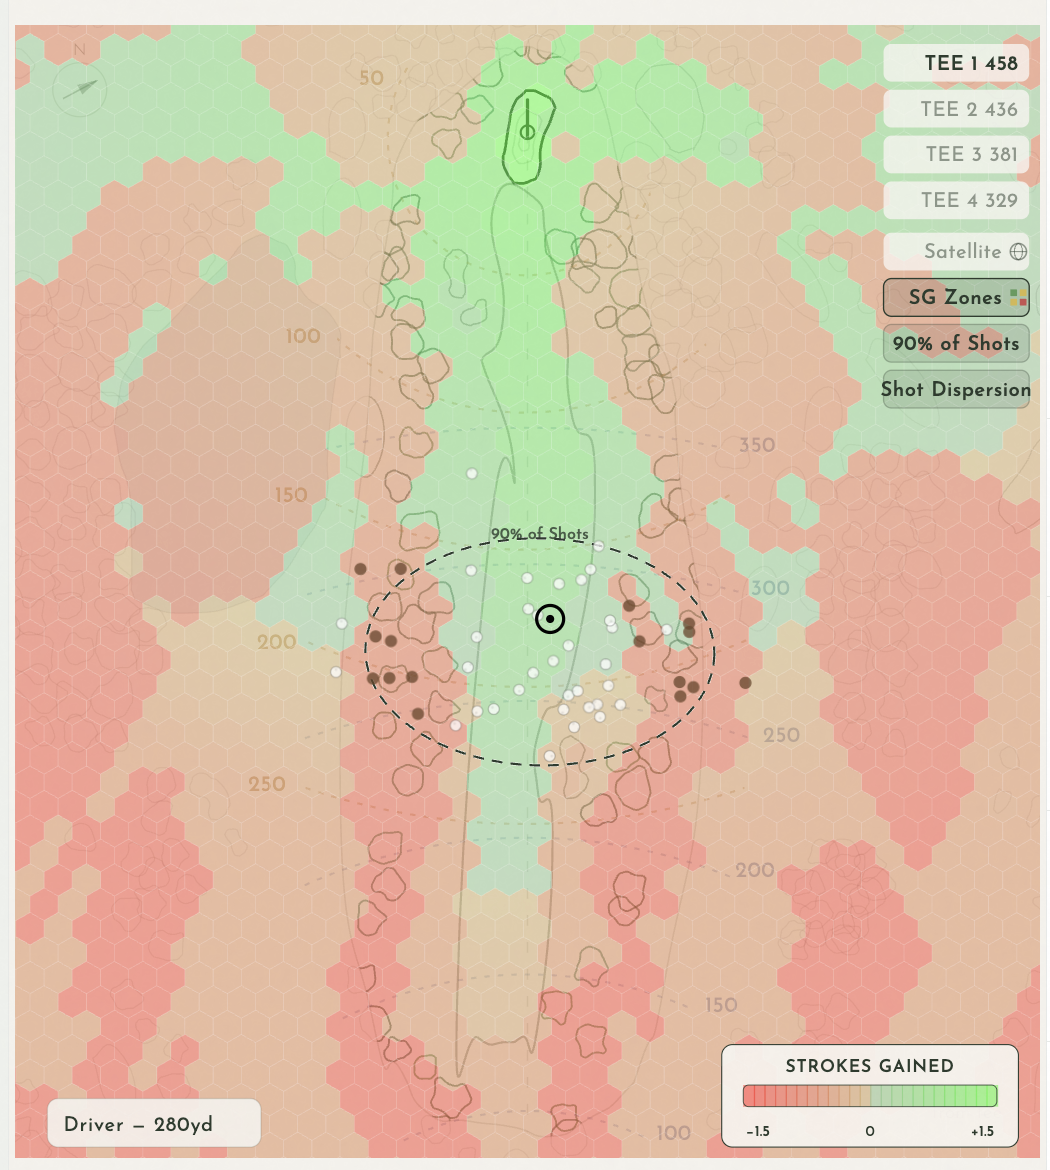
LOADING HOLE Strokes-gained map building…
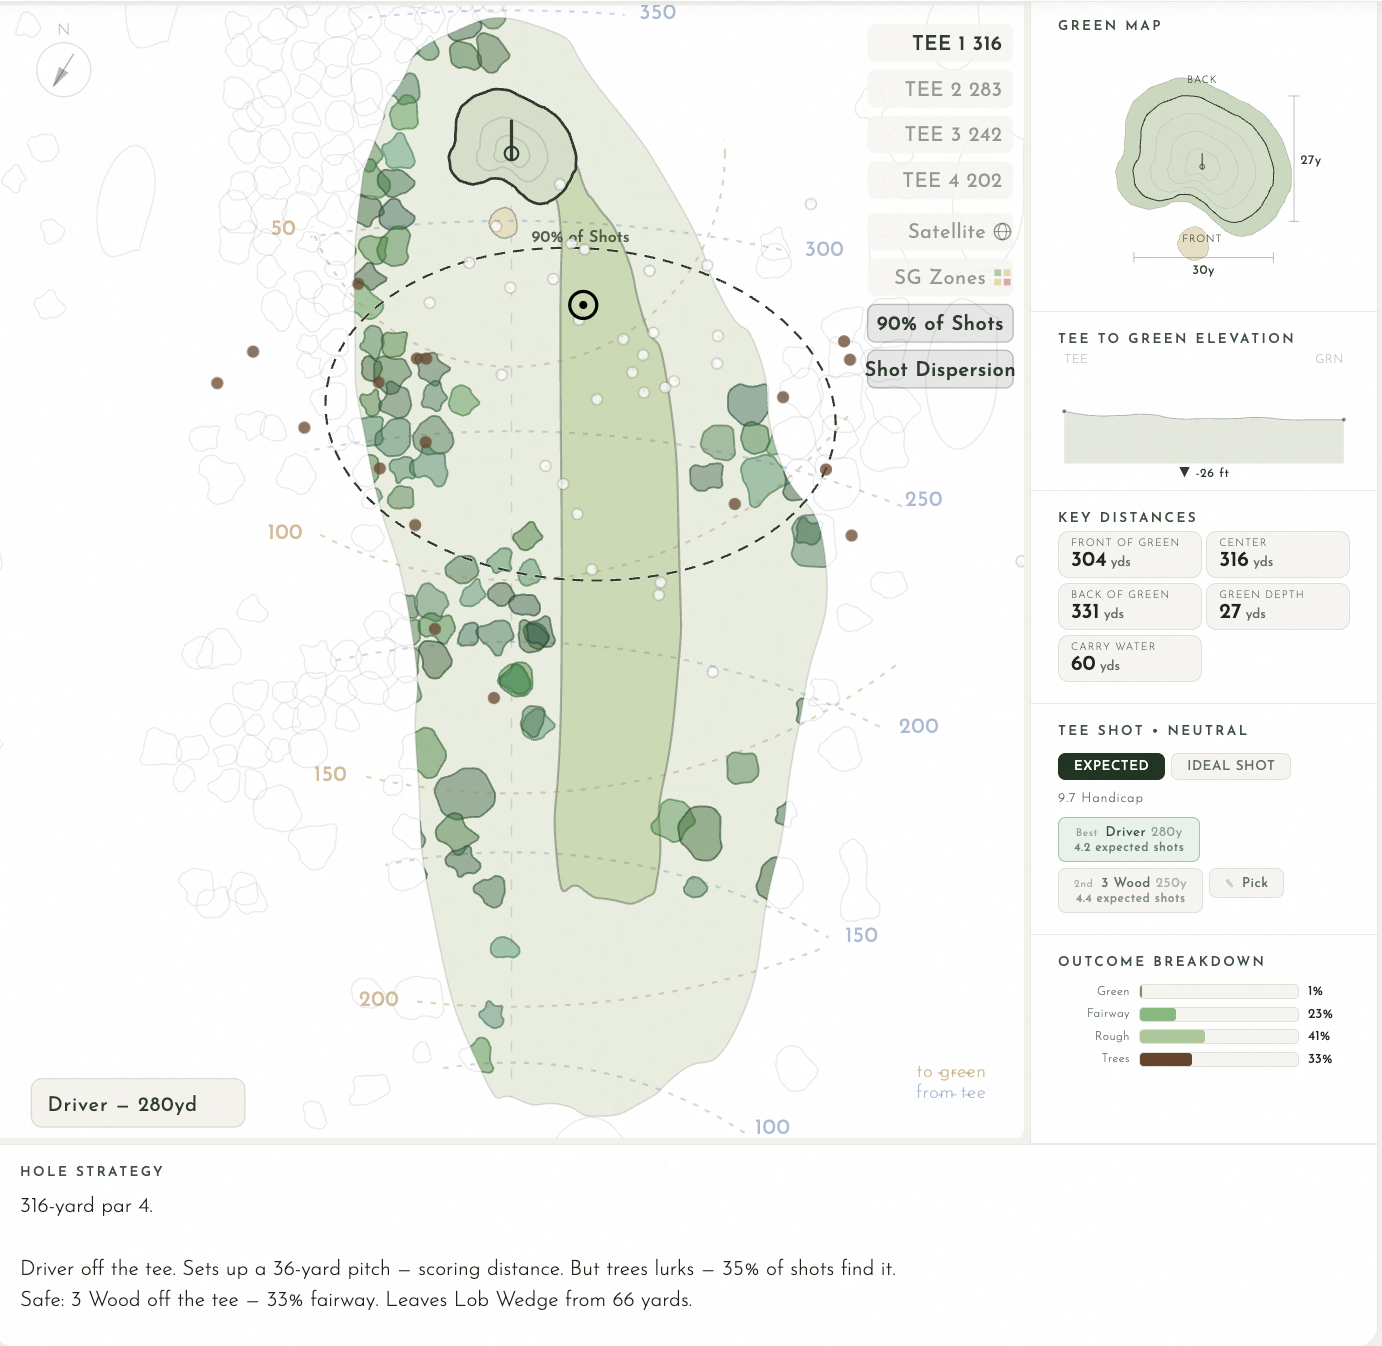
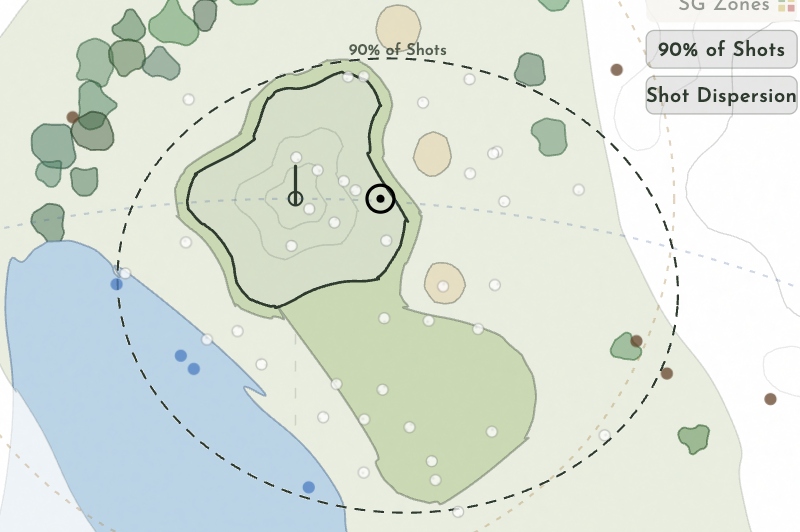
Each dot is a simulated shot · scroll for the club recommendation
Green Map
Key Distances

Report a map problem

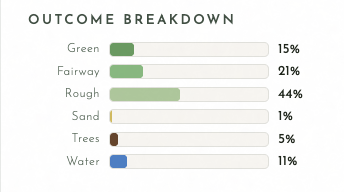
Where It Lands
Scoring Probability
Wind Direction
1 / 18
1 / 18 Swipe to change holes

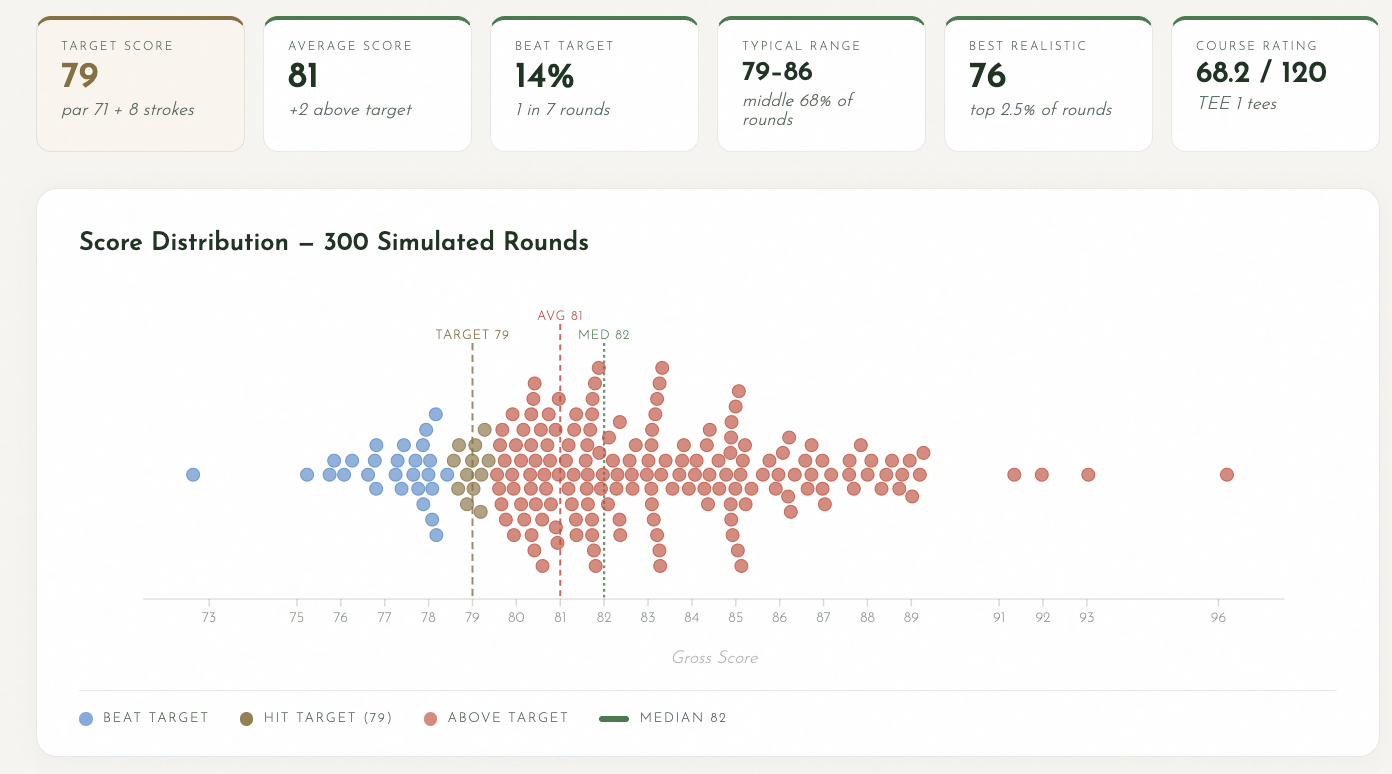
Score Distribution

A statistical model of the scores you're likely to shoot on this course, based on your handicap index.

Handicap
15
Score Distribution, 200 Rounds Drawn From Your Handicap
Methodology Each dot is one round drawn from a statistical model of your handicap and this tee's course rating and slope. The hole-by-hole strategy is not an input, and neither are the hole maps, so this chart and the strategy can disagree. Score differentials follow a positively skewed distribution, bad rounds are more likely than great ones. Standard deviation scales with handicap. It runs from σ ≈ 3.0 at scratch to ~5.0 at 36+. Your handicap index represents your best ~40% of rounds, so your average score runs 2–4 strokes above your target. Dots are placed using a beeswarm algorithm with horizontal jitter to fill gaps between score columns.
Build Yardage Book

Create a pocket-sized yardage book (5" × 6") with hole diagrams, scorecard, and strategy notes.

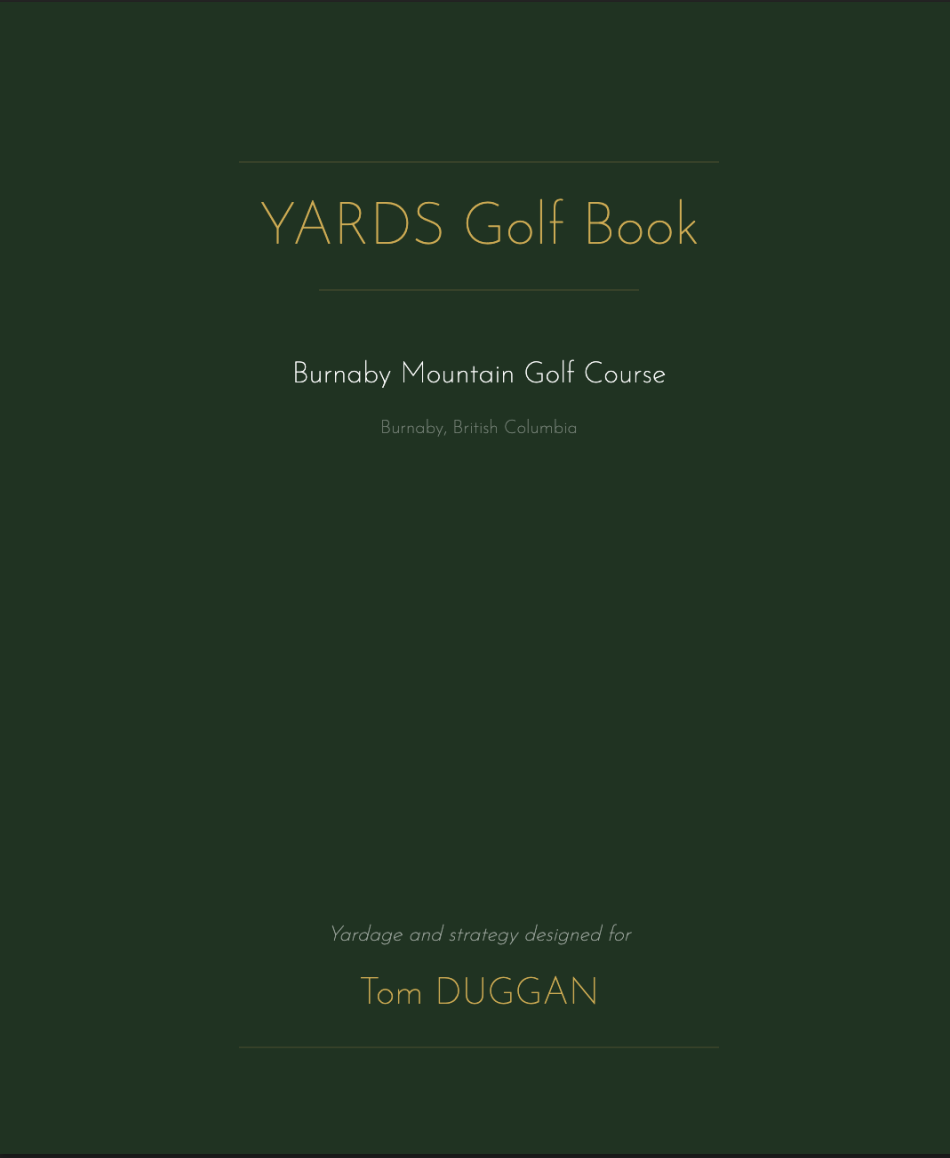
Yardage book cover
Yardage book hole page
Step 1, Choose Your Book
Step 2, Select Your Tees
Step 3, Shot Dispersion

Include your personalized shot dispersion on the hole maps?

Step 4, Strategy Notes

Include strategy notes on each hole? These are personalized recommendations based on your club distances and the course layout.

Your Yardage Book